Friday, 1 October 2010
Civil 3D 2011 Subscription Advantage Pack
Only a handful new features compared to last year's but equally useful. Though I was more excited to hear the release of Update 1 to be honest.
Particularly like enhancements made to importing points and the new(ish) Import Styles and Settings command. I said newish because this was an undocumented command on Civil 3D 2011 pre-SAP. The SAP version now has a dialogue window when the command is executed.
More details and videos here or click the image below.
Wednesday, 29 September 2010
Autocad Civil 3D 2011 Update 1
Although I haven't checked, it should also resolve the issue we are having with plotting dwgs to pdfs.
Update 1 and README can be downloaded here.
Friday, 3 September 2010
Ellipse-shaped Alignments
OPTION 1
Set the PELLIPSE variable to 1 and draw an ellipse. The default is set to 0 which draws an accurate ellipse object. Setting the variable to 1 lets you draw an ellipse made up of series of arcs forming a Polyline. Polylines can then be converted to Civil alignments.
However, ellipse drawn this way won’t result to the correct shape. From visual inspection, the difference between the true ellipse and polyline ellipse is noticeable near the ends of the major axis.
OPTION 2
Use the DIVIDE command to add Autocad points along the true ellipse. The more segments, the better.
Convert the AutoCAD points to COGO points.
Connect the “dots” using SPLINE. Type 'PN to call up the Point Number transparent command. Type the point number range. In my example, 1 – 120 and close the spline.
FLATTEN the closed spline but don’t remove hidden lines.
This will convert it to a series of connected arcs that follow the ellipse more precisely.
Finally convert the polyline to a Civil 3D alignment. It won’t be laser accurate if you zoom in and look closer but isn’t too far off compared to the first option.
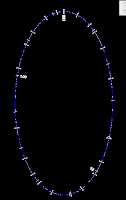
Have a great weekend!!
Tuesday, 13 April 2010
Point - Block - COGO
Points - COGO
Menu: Points > Utilities > Convert from Autocad Points
Ribbon: Home tab > Create Ground Data panel > Points > Convert Autocad Points
Blocks - COGO (UKIE contents tools)
Toolspace: Toolbox tab > UK and Ireland Reports > Additional Tools > Convert Blocks to COGO Points.
If you don’t have UK and Ireland tools, you’ll need to install the UKIE Content Pack. Autodesk’s Dana Probert posted steps to add content packs in her blog.
COGO - Blocks
Menu: Points > Utilities > Create Blocks from COGO Points
Ribbon: Home tab > Create Ground Data panel > Points > Create Blocks from COGO Points
Points - Blocks
Points to COGO then COGO to blocks as above.
Blocks - Points
Create a Surface model using the blocks and amend the style to only show surface points.
Menu: Surfaces > Utilities > Extract Objects from Surface
Ribbon: Click the surface > Surface Tools panel > Extract Objects
Tick (check) Points and either choose Select All or Select the points you want converted.
COGO - Points
Similar to converting blocks to points, create a Surface model using the COGO points and amend the style to only show surface points. Extract the points from the surface using the steps above.
Tuesday, 6 April 2010
Google Map Street View in 3D
Here's the Street view of Cardiff Castle. Click the pegman to view in 3d. I need to find my 3d glasses when I get home!
View Larger Map
Tuesday, 30 March 2010
Friday, 19 March 2010
Visibility Graph
Visibility graph is one requirement in a Sight Stopping Distance (SSD) departure from standards submission to the Highways Agency.
This can be prepared using the new Sight Distance along Corridor tool included in the Civil 3D 2010 Subscription Advantage Pack (SAP) and MS Excel.
The Civil 3D part is pretty simple and quick to do with most work done in Excel.
For my sample data, I have a surface model of a motorway central reserve with concrete step barrier which was created using 3D polylines.
The SAP tools live in the Toolbox tab of the Toolspace.
As in a number of Civil 3D commands, the tool will go through a wizard-type steps to get the desired output. The first box will ask to select a path for the visibility check. This can be in a form of an alignment and profile or feature lines or 3D polylines. This is also where we specify the start and end of the analysis. If an alignment is used for the path, it will ask for a chainage value and if a feature line or 3D polyine is used, points are used. Finally, choose the surface model to use.
The 2nd step is where we input the sight distance parameters such as the minimum SSD, driver’s eye height and offset and target object’s height and offset.
The offset being the offset distance from the path chosen in the first step. For my example my path is the road lane marking between Lane 2 and Lane 3 of the carriageway and I’d like the check to run along the centre of Lane 3.
Use negative (-) offset values if it is to the left side of the path and positive if on the right.
The next step of the wizard is to set whether the analysis components are to be drawn or not and which layers are to be used for each. Lastly, choose whether to create a report for the analysis. Use the CSV style report and chose where to save the report. The report will be saved as a .txt file.
That’s the Civil 3D part done and from here, it’s all MS Excel.
Open MS Excel and open the text file. Choose a Delimited data and comma as the delimiter.
Delete the information header and columns D and E.
Remove the unit “m” from the values by using Replace under the Edit menu. I added a new column where I placed the One Step below Desirable Minimum (relaxed) value of 215 which I also want to show on the graph. These parameters by the way are all in TD 9/93 of the DMRB.
So basically, the first column contains the chainages, 2nd column has the actual sight distance achieved from the analysis, the 3rd column is the desirable minimum sight distance and the 4th column is the relaxed value.
Insert menu> Chart and use a line-type chart and click Next.
On the 2nd step of the wizard, click the Series tab and click Add.
Give the Series a name. In my example I used “Visibility”. For the Values field, click the Value button and select the column B data (select and drag from Row 1 down to the row of the last value). For Category (X) axis labels, select the Column A data.
Click Add to create another Series and name it 295. For the Values field, click the Value button and select the Column C data.
Click Add to create another series and name it 215. For the Values field, click the Value button and select the Column D data.
Click Next and under the Titles tab, put Visibility for Chart title, Chainage for Category (X) axis and SSD in the Value (Y) axis.
Last step is to choose if the chart will be placed in a new sheet or as an object in the current worksheet and click Finish.
The graph will look similar to the image below. For better presentation, you can always go back and change the format/style of the different parts of the graph by selecting them and right click.
Here’s how a final output may look like.
Have a good weekend everyone!
Wednesday, 3 February 2010
Profile from file
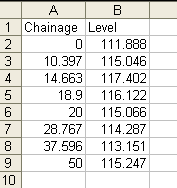
I'm sure skilled programmers can easily produce an Excel VBA script or similar and output into a dxf file. Another option is to do it manually but will surely take ages. Here's how to do it in Civil 3D.
Create a new drawing. Create an alignment with length equal to the last chainage on the spreadsheet. This can simply be a long straight alignment. Create a profile view.
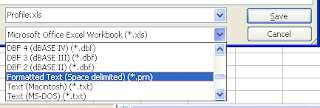
Next remove any headers on the spreadsheet leaving only the values. Save the spreadsheet to a .prn file (space delimited) format. Then change the file extension to .txt as this is the format Civil 3D will look for.
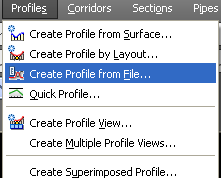
Import the text file. Profiles> Create Profile from File.
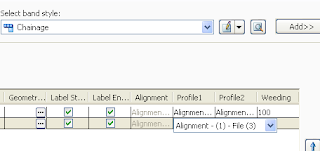
Once the profile line appears on profile view, the profile source might need to be set for correct values in the bands.
Wednesday, 27 January 2010
Section View Axis Offset
We lately had some confusion at work when one of our technicians was given an exported Civil 3d section to work up details and setting out drawings for a motorway variable message sign foundation.
He was offsetting the section view left and right axes to set out the foundation which he assumed correspond with the ends of the section line. The offset lines however appear to be in the wrong place when checked against the carriageway features on plan.
Going back to the Civil 3D drawing where the section was exported from, we found out that the problem was the left and right axes offset of the section view style being set to 5. This made the cross section view 10 units longer than the section line – an extra 5 on each end. Setting it to 0 corrected the problem.
Also worth noting that the axis offset values are specified in plotted units based on the drawing scale set on the Drawing Settings (Toolspace, Settings tab> right click the drawing name> Edit drawings settings). I.e. if the drawing setting scale is set to 1:500 and the axis offset is set to 5, the offset on the drawing will be 2.5.


