We have two separate surfaces shown on a section view and we’d like to show offset labels for both surfaces in one band box. Both surfaces came from two different types of surveys so we’d like to show them separate on section view (i.e. different linetype and colour).
I could think of two ways to do this. One is by combining the 2 surfaces. Second is by manipulating data bands.
Option 1
This is the quicker and simpler of the 2. Combine the 2 surfaces and sample the new combined surface.
Hide the section line from View.
Use the combined surface data for the bands.
Option 2
This option is a little messy but just thought it would be good to include this anyway to show an example on how labels can be manipulated to get desired presentation.
Copy the current Offset band style.
Under Band Details tab, select the type of label you want to show, for my example I’m showing labels at section Gradient Breaks and select Compose label… Take note of the Band Height used.
Change the Y-Offset to whatever band height you have above, 15 for my example. Basically, what I’m doing is creating a new Offset band box and moving all labels (and ticks if any) one box up but showing only the labels.
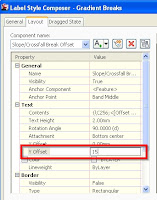
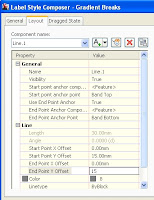
Back to the Display Tab in Data Box Style, turn off all components except for Ticks and Labels at Gradient Breaks.
Add the new band style to the set and change the surface for Section 1. Thus on my example below, the style ANZ_(Rd) - Offsets (Grade Breaks) refers to the Hydrographic Survey surface (red section lines) and ANZ_(Rd) - Offsets (Grade Breaks) 2 refers to the Ex_Contours_Adjusted surface (green dashed line).


 Posts
Posts


